Interesting tool of the day: ghc-gc-tune
Posted on December 30, 2012 with tags haskell. See the previous or next posts.
Courtesy of a recent Google+ post/Stack overflow answer, I stumbled upon ghc-gc-tune, a simple but nice tool which generates interesting graphs for Haskell programs.
What is does is quite trivial: iterate over a range of arena and heap sizes, and run a specified program with those RTS options, then generate a graph comparing the performance (by default cpu time) across the combinations of the values.
Note that for newer GHC versions, you’ll need to link with -rtsopts
to allow for the -A/-H custom sizes.
The reason I mention it is that the graphs it generates can be quite
interesting. For one of the Ganeti programs, hspace, run with the
command line ./hspace --simu p,20,1t,96g,16,1 --disk-template drbd,
it generates this graph:
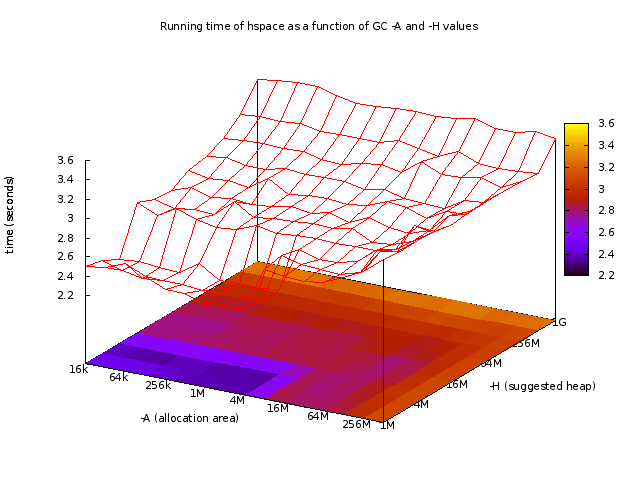
This picture, if I read it correctly, says that this program is
actually well behaved (well, +RTS -s says “3 MB total memory in use”
with default options), and that the optimum sizes actually relate to
the (L1? L2?) cache size. But note that the maximum difference is
only about ~1.6×.
By changing the parameters to hspace and make it allocate more memory
(./hspace --simu p,20,1t,128g,256,32 --disk-template plain --tiered=1g,128m,1, ~52MB reported by +RTS -s), the graph changes
significantly:
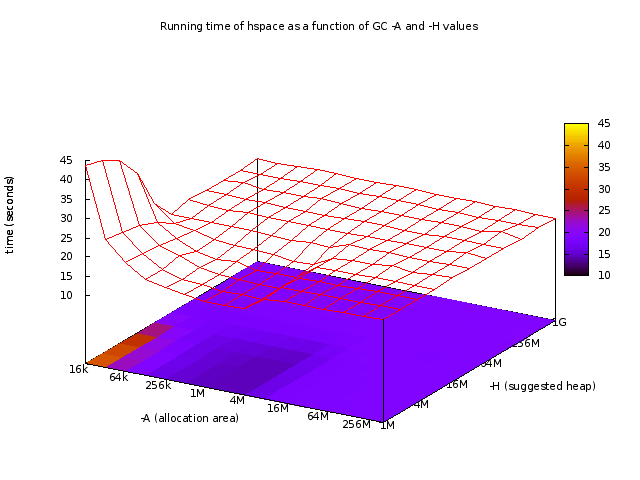
Now we have somewhat the opposite situation: very small arena sizes are detrimental (and by a big factor, 4.5×), large arena/heap sizes are OK-ish, and the sweet spot is around 2-4MB arena size with heap sizes up to 4MB.
Now maybe these particular examples were not very elightening (and they were definitely not well-conducted tests, etc.), but they should allow some intuition into how the program behaves. Plus, the tool can also generate other plots, for example peak memory usage.