Usefulness of real-time data during cycling
Posted on September 4, 2016 with tags cycling. See the previous or next posts.
Wow, a mouthful of a title, for a much simpler post.
Up until earlier this year, I had only one sport GPS device, and that was a watch. Made sense, as my “main” sport was running (not that I did it very consistently). Upgraded over a few generations of Garmins, I mainly used it to record my track and statistics (pace, heart rate, etc.) The newest generation of watch and heart rate monitor even give more statistics (left-right leg balance, ground contact time, so on).
Most of this data can be looked at while running, but only as an exception; after all, it’s very hard to run with one hand up in front of your face. The other useful features—guided workouts and alerts during normal runs—I’ve used, but not consistently.
So when I started biking a bit more seriously, I wondered whether it would make sense to buy a bike computer. The feature intersection between watch and bike GPS is quite large, so clearly this is a “want” not a “need” by far. Reading forum posts showed the same question repeated multiple times… What convinced me to nevertheless buy such a bike GPS were the mapping/routing features. A bike GPS with good routing features, or even just maps on which tracks can be overlayed, can certainly ease the discovery of new routes.
After a few months of use, my most useful feature is one that I didn’t expect. While the mapping is useful and I do use it, the one that actually is significantly better than my watch is the large display with data fields that I can trivially check almost continuously on road biking, and during technically easy climbing sections for mountain biking.
My setup looks like this:
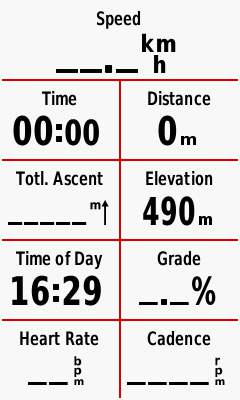
It’s a 9-field setup; the Edge 1000 can go to 10, but I like “headline” field. The watch can only go to four, and is basically not usable during rides, unless one would use a quick-release kit for mounting on the handle bar.
This setup allowed me to learn much better my physical capabilities, why I sometimes run out of energy, and how the terrain affects me. Random things that I learned:
- Gradient: on a road bike, +2% grade is just fun, -2% grade is excellent; on a mountain bike, -2% is somewhat felt but not so much. Going above 6-8% on a mountain bike is tiring, and above 15% means I can bike but I will dip too much into my reserves. Not sure yet what the numbers are on a road bike…
- Cadence: on flatter routes, my most efficient cadence is 102-108 RPM; between 98-102 I feel I need to extra push, and below 98 I know (now) my muscles will get tired too early; on significant ascents, I don’t have enough gearing to sustain such an RPM, and that tires me faster. On medium distance flat rides (~70Km), I usually do ~100 averaged over the whole distance.
- Heart rate: below ~140 is recovery, ~140-150 is sustained effort, ~150-160 is short-duration pushes, and anything above ~160 will eat through my anaerobic budget, which means I’d better stop soon or my performance for the rest of the ride will suffer; this, surprisingly, matches quite well with my latest run lactate threshold (as computed by my watch), which was 161bpm.
- Condition: when cruising without pedalling or when stopping, I can ballpark my current condition very easily by seeing how fast my heart rate goes down.
- Total ascent: useful for two things: to make me proud how much I’ve already climbed, and—if I know the total ascent for the route—either make me despair how much I have left, or make me happy that the climbs are done :-)
Seeing all this data only after the ride is less useful since you don’t remember exactly how you felt during specific points in the ride. But as real-time data, one can easily see/feel the correlation between how the body feels and what data says.
One thing that would be also useful would be real-time power data (3 sec average, not instantaneous) to correlate even better with the body state. I now use heart rate and cadence as a proxy for that, but being able to see actual power numbers would increase the usefulness of the data even more.
Unfortunately, none of these makes the climbs easier. But at least it allows me to understand why one climb feels hard and another easy (relatively speaking). I wonder if, and how this could be applied to running; maybe with smart glasses?
Conclusion: yes, I do recommend a bike computer with a large display (to be able to see many fields at once). Just in case one has disposable income at hand and doesn’t know which hobby to spend it on ;-)