System load and ping latency strangeness
Posted on January 4, 2020 with tags tech. See the previous or next posts.
Having fun with computers :)
So, instead of a happy new year post or complaining about Debian’s mailing list threads (which make me very sad), here’s an interesting thing (I think).
Having made some changes to the local network recently, I was
surprised at the variability in ping latency on the local network but
also to localhost! I thought, well, such is Linux, yada yada, it’s a
kernel build with CONFIG_NO_HZ_IDLE=y, etc. However looking at the
latency graph an hour ago showed something strange: latencies
stabilised… and then later went bad again. Huh?
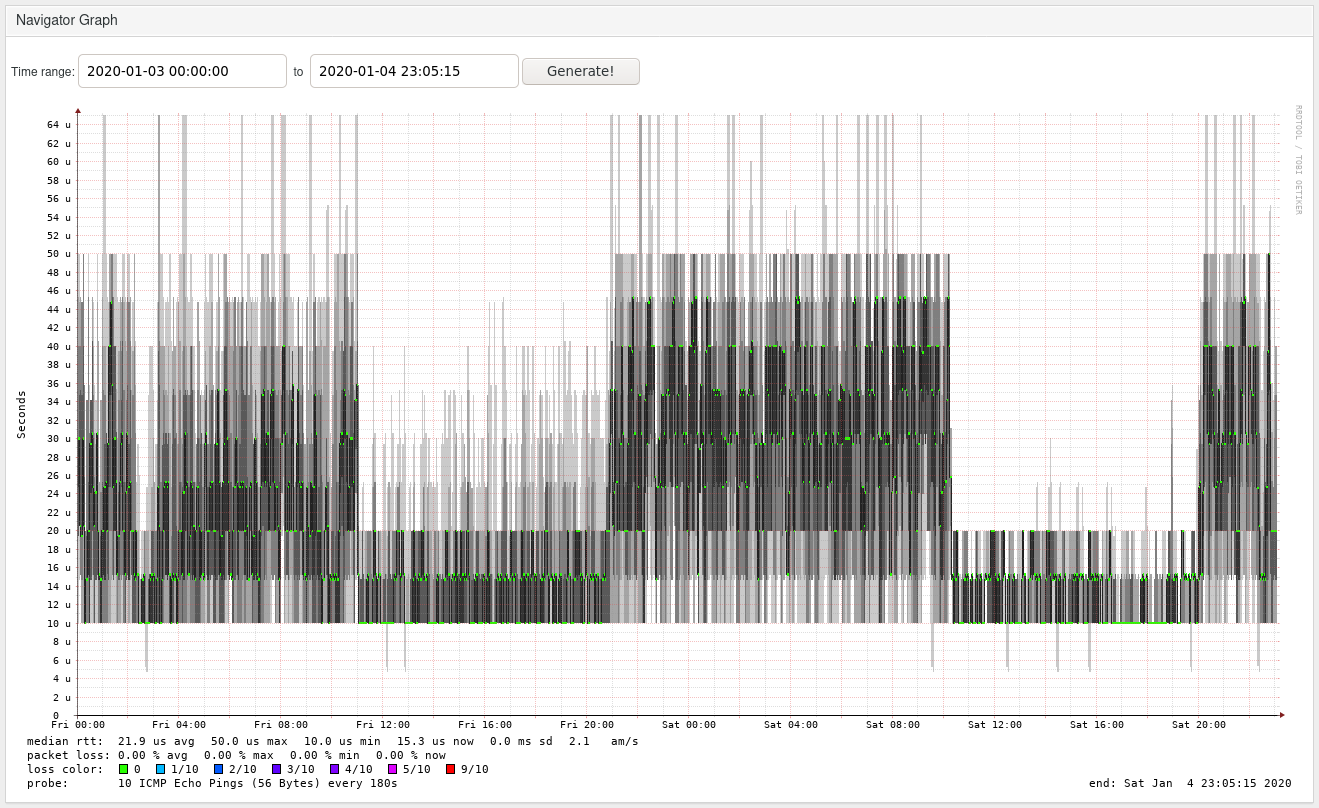
This is all measured via smokeping, which calls fping 10 times in a row, and records both average and spread of the values. For “stable”, I’m talking here about a somewhat even split between 10µsec and 15µsec (for the 10-ping average), with very consistent values, and everything between 20µsec and 45µsec, which is a lot.
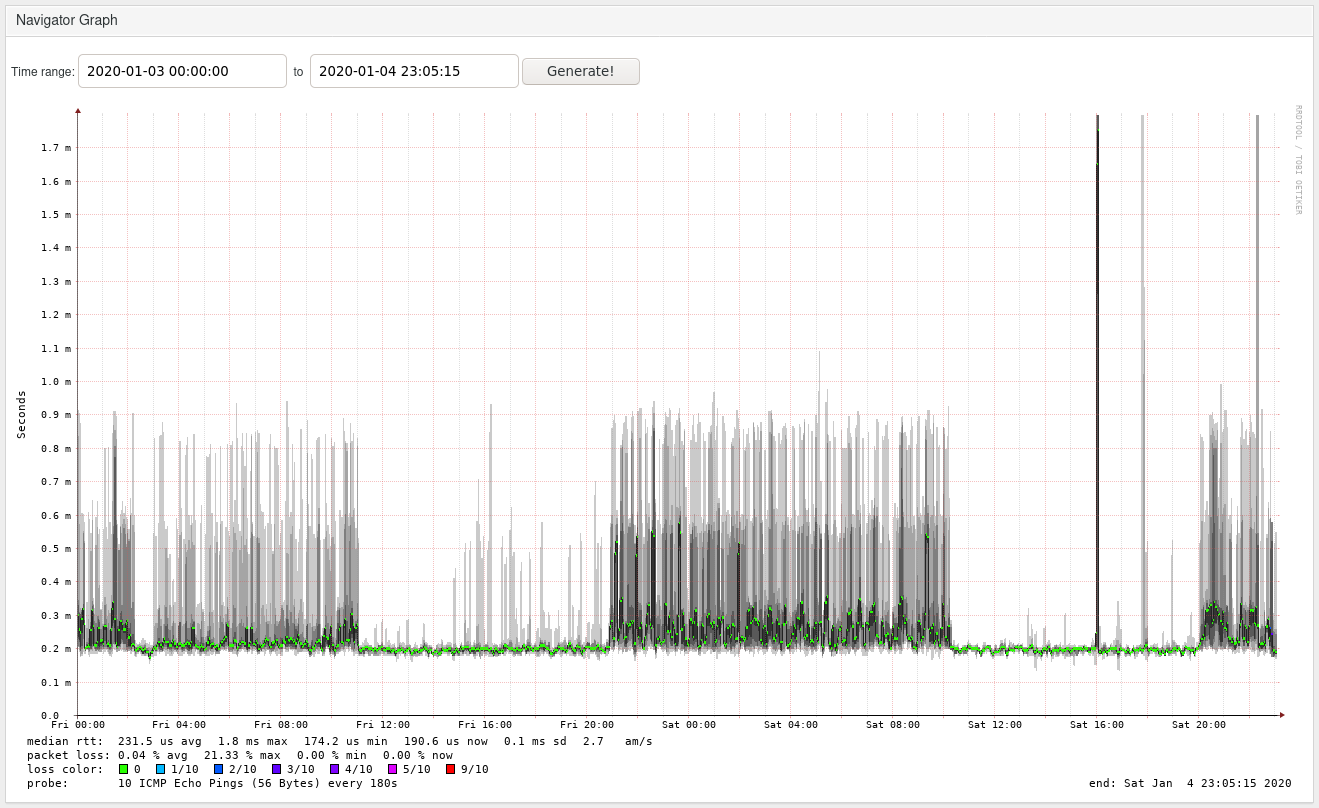
For the local-lan host, it’s either consistently 200µsec vs 200-300µsec with high jitter (outliers up to 1ms). This is very confusing.
The timing of the “stable” periods aligned with times when I was running heavy disk I/O. Testing quickly confirmed this:
- idle system:
localhost : 0.03 0.04 0.04 0.03 0.03 0.03 0.03 0.03 0.03 0.03 - pv /dev/md-raid5-of-hdds:
localhost : 0.02 0.01 0.01 0.01 0.01 0.01 0.03 0.03 0.03 0.02 - pv /dev/md-raid5-of-ssds:
localhost : 0.03 0.01 0.01 0.01 0.01 0.02 0.02 0.02 0.02 0.02 - with all CPUs at 100%, via
stress -c $N:localhost : 0.02 0.00 0.01 0.00 0.01 0.01 0.01 0.01 0.01 0.01 - with CPUs idle, but with governor performance so there’s no
frequency transition:
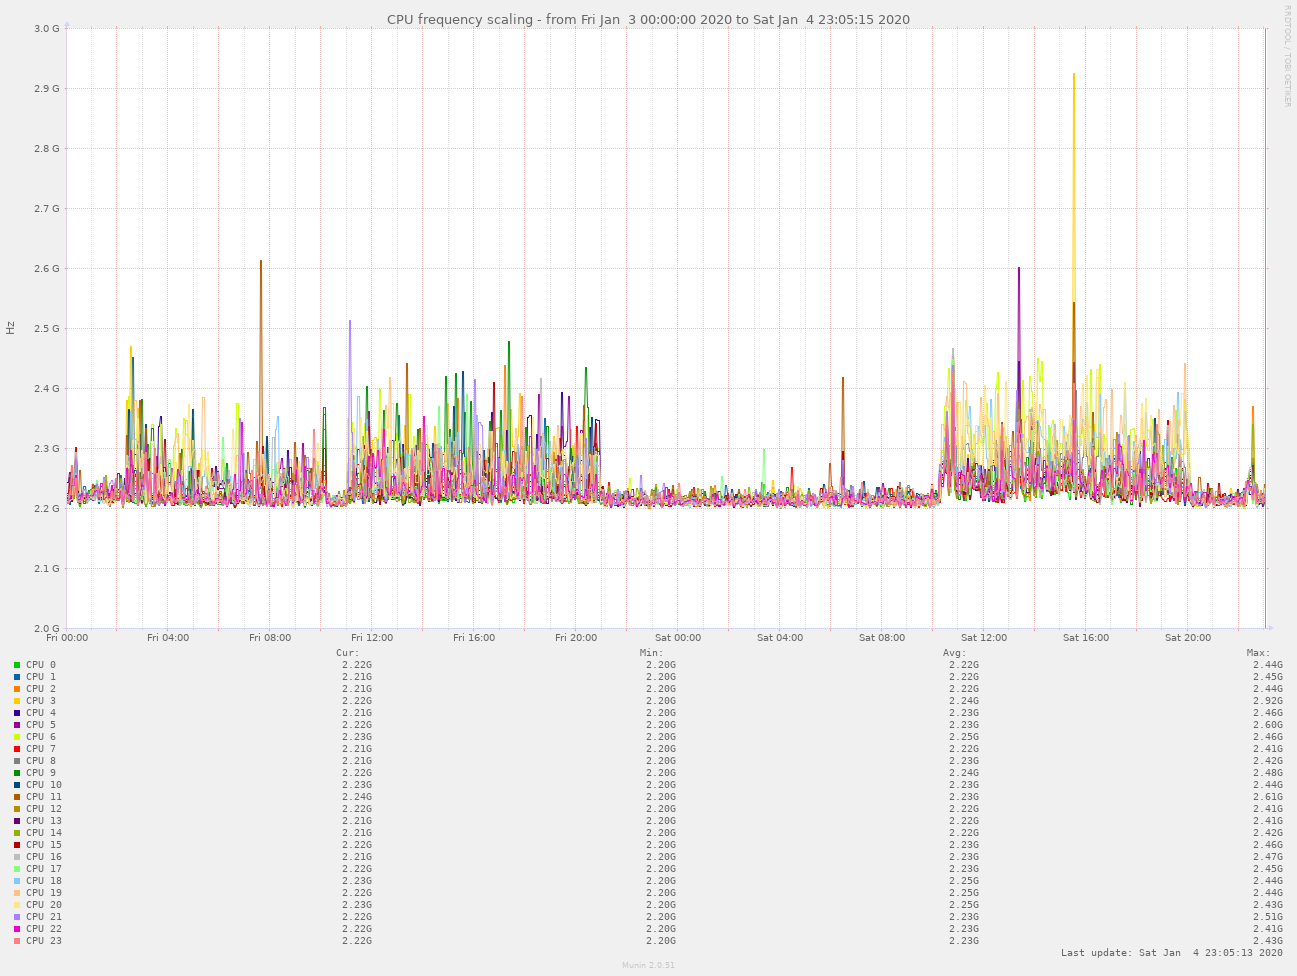
localhost : 0.01 0.15 0.03 0.03 0.03 0.03 0.03 0.03 0.03 0.03
So, this is not CPU frequency transitions, at least as seen by Linux. This is purely CPU load, and, even stranger, it’s about single core load. Running the following in parallel:
taskset -c 8 stress -c 1andtaskset -c 8 fping -C 10 localhost
Results in the awesome values of:
localhost : 0.01 0.01 0.00 0.00 0.00 0.00 0.00 0.00 0.00 0.01Now, that is what I would expect :) Even more interesting, running
stress on a different CPU (any different CPU) seems to improve things,
but only by half (using ping which has better resolution).
To give a more graphical impression of the latencies involved (staircase here is due to fping resolution bug, mentioned below):


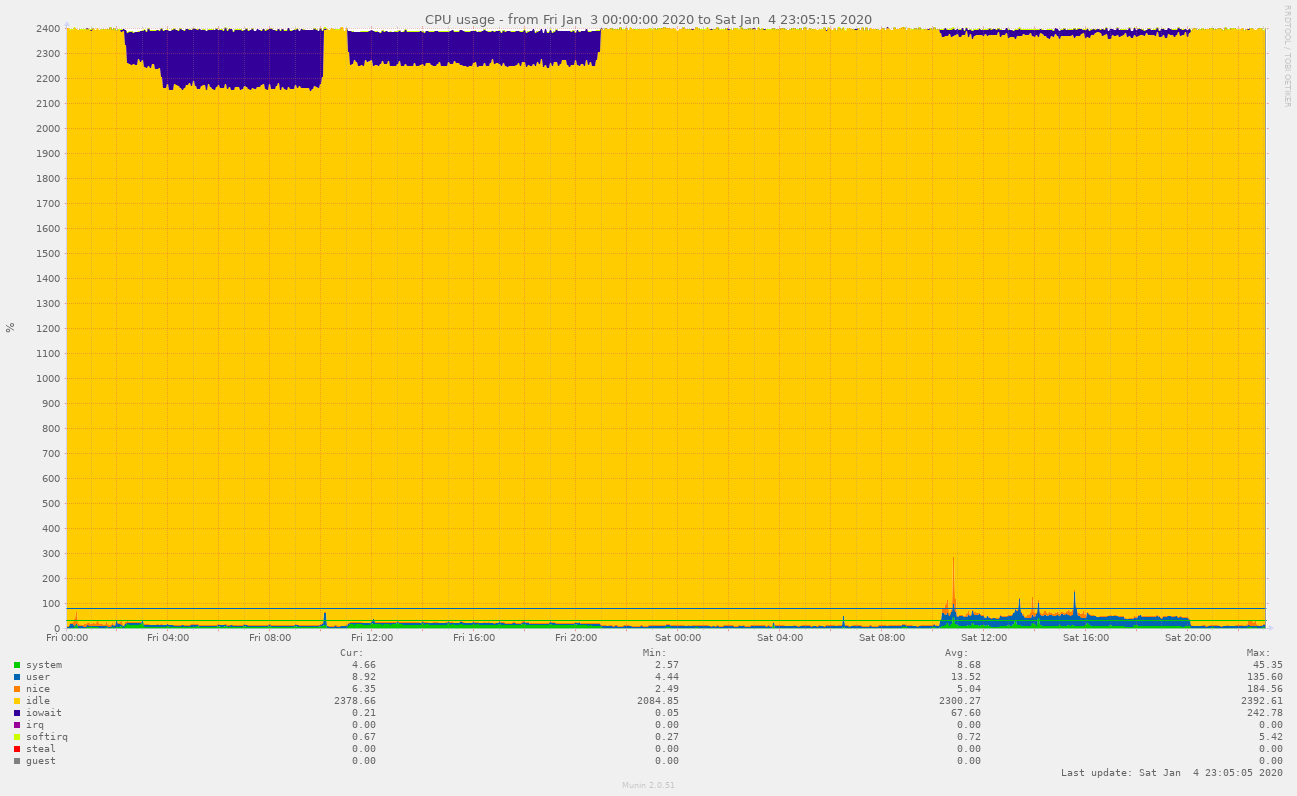
Note that plain I/O wait (the section at the top) doesn’t affect latency; only actual CPU usage, as seen at Fri 02:00-03:00 and then later 11:00-21:00 and (much higher) Sat 10:15-20:00.
If you squint, you can even correlate lower CPU usage on Fri 16:00-21:00 to slightly increased latencies.

Does this all really matter? Not really, not in any practical sense. Would I much prefer clean, stable ping latencies? Very much so.
I’ve read the documentation on no HZ, which tells me I should be rebooting about 20 or 30 times with all kinds of parameter combinations and kernel builds, and that’s a bit too much from my free time. So maybe someone has some idea about this, would be very happy to learn what I can tune to make my graphs nicer :)
I’ve also tested ping from another host to this host, and high CPU usage results in lower latencies. So it seems to be not user-space related, but rather kernel latencies?!
I’ve also thought this might be purely an fping
issue; however, I
can clearly reproduce it simply by watching ping localhost which
running (or not) stress -c $N; the result is ~10-12µsec
vs. ~40µsec.
Thanks in advance for any hints.