Perf stats for doing "nothing"
Posted on February 11, 2012 with tags tech. See the previous or next posts.
I’ve recently discovered the perf Linux tool. I heard that oprofile
was deprecated and that there is a new tool, and I noted down to try
it sometime.
Updated: more languages, fixed typos, more details, some graphs. Apologies if this shows twice in your feed.
The problem with perf stats is that I hate bloat, or even perceived bloat. Even when it doesn’t affect me in any way, the concept of wasted cycles makes me really sad.
You probably can guess where this is going… I said, well, let’s see what perf says about a simple “null” program. Surely doing nothing should be just a small number of instructions, right?
Note: I think that perf also records kernel-side code, because the
lowest I could get was about ~50K instructions for starting a null
program in assembler that doesn’t use libc and just executes the
syscall asm instruction. However, these ~50K instructions are noise
the moment you start to use more high-level languages. Yes, this is
expected, but the I was still shocked. And there’s lots of delta
between languages I’d expected to behave somewhat identical.
Again, this is not important in the real world. At all. They are just numbers, and probably the noise (due to short runtime) has lots of influence on the resulting numbers. And I might have screwed up the measurements somehow.
Test setup
Each program was the equivalent of ‘exit 0’ in the appropriate form
for the language. During the measurements, the machine was as much as
possible idle (single-user mode, measurements run at real-time
priority, etc.). For compiled languages, -O2 was used. For scripts,
a simple #!/path/to/interpreter (without options, except in the case
of Python, see below) was used. Each program/script was run 500 times
(perf’s -r 500) and I’ve checked that the variations were small
(±0.80% on the metrics I used).
You can find all the programs I’ve used at http://git.k1024.org/perf-null.git/, the current tests are for the tag version perf-null-0.1.
The raw data for the below tables/graphs is at perf-null/log-4.
Results
Compiled languages
| Language | Cycles | Instructions |
|---|---|---|
| asm | 63K | 51K |
| c-dietlibc | 74K | 57K |
| c-libc-static | 177K | 107K |
| c-libc-shared | 506K | 300K |
| c++-static | 178K | 107K |
| c++-dynamic | 1,750K | 1,675K |
| haskell-single | 2,229K | 1,338K |
| haskell-threaded | 2,629K | 1,522K |
| ocaml-bytecode | 3,271K | 2,741K |
| ocaml-native | 1,042K | 666K |
Going from dietlibc to glibc doubles the number of instructions, and for libc going from static to dynamic linking again roughly doubles it. I didn’t manage to compile a program dynamically-linked against dietlibc.
C++ is interesting. Linked statically, it is in the same ballpark as C, but when linked dynamically, it executes an order of magnitude (!) more instructions. I would guess that the initialisation of the standard C++ library is complex?
Haskell, which has a GC and quite a complex runtime, executes slightly less instructions than C++, but uses more cycles. Not bad, given the capabilities of the runtime. The two versions of the Haskell program are with the single-threaded runtime and with the multi-threaded one; not much difference. A fully statically-linked Haskell binary (not recommended usually) goes below 1M instructions, but not by much.
OCaml is a very nice surprise. The bytecode runtime is a bit slow to startup, but the (native) compiled version is quite fast to start: only 2× number of instructions and cycles compared to C, for an advanced language. And twice as fast as Haskell ☺. Nice!
Shells
| Language | Cycles | Instructions |
|---|---|---|
| dash | 766K | 469K |
| bash | 1,680K | 1,044K |
| mksh | 1,258K | 942K |
| mksh-static | 504K | 322K |
So, dash takes ~470K instructions to start, which is way below the C++ count and a bit higher than the C one. Hence, I’d guess that dash is implemented in C ☺.
Next, bash is indeed slower on startup than dash, and by slightly more
than 2× (both instructions and cycles). So yes, switching /bin/sh
from bash to dash makes sense.
I wasn’t aware of mksh, so thanks for the comments. It is, in the
static variant, more efficient that dash, by about 1.5×. However, the
dynamically linked version doesn’t look too great (dash is also
dynamically linked; I would guess a statically-linked dash “beats”
mksh-static).
Text processing
I’ve added perl here (even though it’s a ‘full’ language) just for comparison; it’s also in the next section.
| Language | Cycles | Instructions |
|---|---|---|
| mawk | 849K | 514K |
| gawk | 1,363K | 980K |
| perl | 2,946K | 2,213K |
A normal spread. I knew the reason why mawk is Priority: required is
that it’s faster than gawk, but I wouldn’t have guessed it’s almost
twice as fast.
Interpreted languages
Here is where the fun starts…
| Language | Cycles | Instructions |
|---|---|---|
| lua 5.1 | 1,947K | 1,485K |
| lua 5.2 | 1,724K | 1,335K |
| lua jit | 1,209K | 803K |
| perl | 2,946K | 2,213K |
| tcl 8.4 | 5,011K | 4,552K |
| tcl 8.5 | 6,888K | 6,022K |
| tcl 8.6 | 8,196K | 7,236K |
| ruby 1.8 | 7,013K | 6,128K |
| ruby 1.9.3 | 35,870K | 35,022K |
| python 2.6 -S | 11,752K | 10,247K |
| python 2.7 -S | 11,438K | 10,198K |
| python 3.2 -S | 29,003K | 27,409K |
| pypy -S | 21,106K | 10,036K |
| python 2.6 | 25,143K | 21,989K |
| python 2.7 | 47,325K | 50,217K |
| python 2.7 -O | 47,341K | 50,185K |
| python 3.2 | 113,567K | 124,133K |
| python 3.2 -O | 113,424K | 124,133K |
| pypy | 90,779K | 68,455K |
The numbers here are not quite what I expected. There’s a huge delta between the fastest (hi Lua!) and the slowest (bye Python!).
I wasn’t familiar with Lua, so I tested it thanks to the comments. It is, I think, the only language which actually improves from one version to the next (bonus points), and where the JIT version also make is faster. In context, lua jit starts faster than C++.
Perl is the one that goes above C++‘s instructions count, but not by much. From the point of view of the system, a Perl ’hello world’ is only about 1.3×-1.6× slower than a C++ one. Not bad, not bad.
Next category is composed of TCL and Ruby, both of which had older versions 2-3× slower than Perl, but whose most recent versions are even more slower. TCL has an almost constant slowdown across versions (5M, 6.9M, 8.2M cycles), but Ruby seems to have taken a significant step backwards: 1.9.3 is 5× slower than 1.8. I wonder why? As for TCL, I didn’t expect it to be slower to startup than Perl; good to know.
Last category is Python. Oh my. If you run perf stat python -c 'pass' you get some unbelievable numbers, like 50M instructions to
do, well, nothing. Yes, it has a GC, yes, it does import modules at
runtime, but still… On closer investigation, the site module and the
imports it does do eat a lot of time. Running a simpler python -S
brings it back to a more reasonable 10M instructions, which is in-line
with the other interpreted languages.
However, even with the -S taken into account, Python also slows down
across versions: a tiny improvement from 2.6 to 2.7, but (like Ruby) a
3× slowdown from 2.7 to 3.2. Trying the “optimised” version (-O)
doesn’t help at all. Trying pypy, which was based on Python 2.7, makes
it around 2× slower to startup (both with and without -S).
So in the interpreted languages, it seems only Lua is trying to improve, the rest of the languages are piling up bloat with every version. Note: I should have tried multiple perl versions too.
Java
Java is in its own category; you guess why ☺, right?
GCJ was version 4.6, whereas by java below I mean OpenJDK Runtime Environment (IcedTea6 1.11) (6b24-1.11-4).
| Language | Cycles | Instructions |
|---|---|---|
| null-gcj | 97,156K | 74,576K |
| java -jamvm | 85,535K | 80,102K |
| java -server | 147,174K | 136,803K |
| java -zero | 132,967K | 124,977K |
| java -cacao | 229,799K | 205,312K |
Using gcj to compile to “native code” (not sure whether that’s native-native or something else) results in a binary that uses less than 100M cycles to start, but the jamvm VM is faster than that (85M cycles). Not bad for java! Python 3.2 is slower to startup—yes, I think the world has gone crazy.
However, the other VMs are a few times slower: server (the default one) is ~150M cycles, and cacao is ~230M cycles. Wow.
The other thing about java is that it was the only one that couldn’t
be put nicely in a file that you just ‘exec’ (there is binfmt_misc
indeed, but that doesn’t allow different Java classes to use different
Java VMs, so I don’t count this), as opposed to every single other
thing I tested here. Someone didn’t grow on Unix?
Comparative analysis
Since there are almost 4 orders of magnitude difference between all the things tested here, a graph of cycles or instructions is not really useful. However, cycles/instruction, branches percentage and branches miss-predicted percentage can be. Hence first the cycles/instructions:
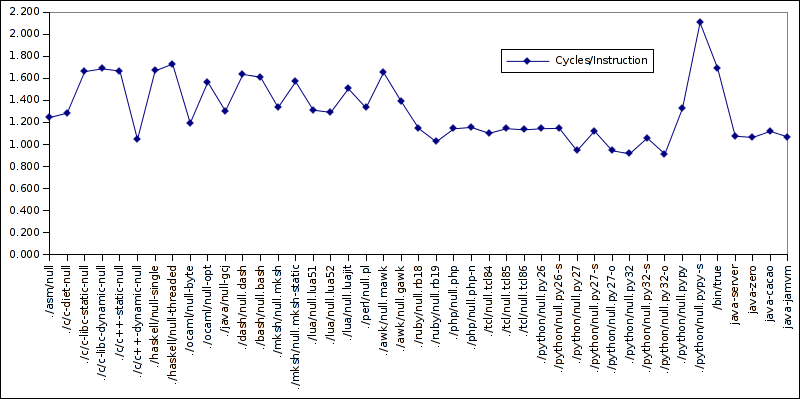
Pypy is jumping out of the graph here, with the top value of over 2 cycles/instruction. Lua JIT is also bigger than Lua non-JIT, so maybe there’s something to this (mostly joking, two data points don’t make a series). On the other hand, Python wins as best cycles/instruction (0.91). Lots of ILP, to get below 1?
Java gets, irrespective of VM, consistently near 1.0-1.1. C++ gets very different numbers between static linking (1.666) and dynamic linking (1.045), whereas C has basically identical numbers. mksh also has a difference between dynamic and static linking. Hmm…
Ruby, TCL and Python have consistent values across versions.
And that’s about what I can see from that graph. Next up, percentage of branches out of total instructions and percentage of branches missed:
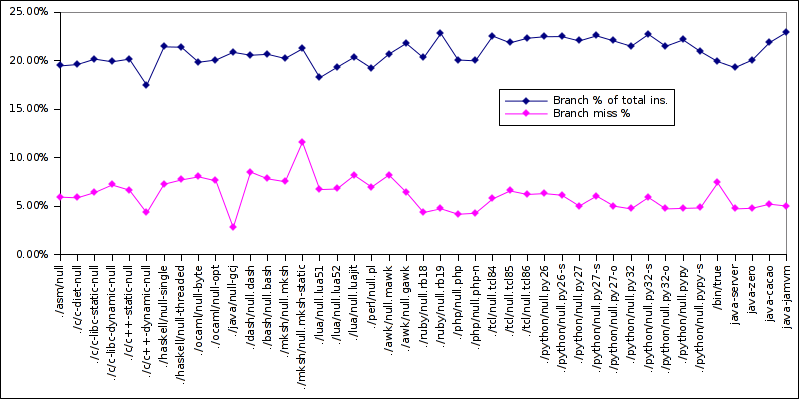
Note that the two lines shouldn’t really be on the same graph; for the branch %, the 100% is the total instructions count, but for the branch miss %, the 100% is the total branch count. Anyway.
There are two low-value outliers:
- dynamically-linked C++ has a low branch percentage (17.46%) and a very low branch miss percentage (only 4.32%)
- gcj-compiled java has a very low branch miss percentage (only 2.82%!!!), even though is has a “regular” branch percentage (20.85%)
So it seems the gcj libraries are well optimised? I’m not familiar enough with this topic, but on the graph it does indeed stand out.
On the other end, mksh-static has a high branch miss percentage: 11.60%, which jumps clearly ahead of all the others; this might be why it has a high cycles/instruction count, due to all the stalls in misprediction; one has to wonder why it confuses the branch predictor?
I find it interesting that the overall branch count is very similar across languages, both when most of the cost is in the kernel (e.g. asm) and when the user-space cost heavily over-weighs the kernel (e.g. Java). The average is 20.85%, minimum is 17.46%, max 22.93%, standard deviation (if I used gnumeric correctly) is just 0.01. This seems a bit suspicious to me ☺. On the other hand, the mispredicted branches percentage varies much more: from a measly 2.82% to 11.60% (5x difference).
Summary
So to recap, counting just instructions:
- going from dietlibc to glibc: 2× increase
- going from statically-linked libc to dynamically-linked libc: doubles it again
- going from C to C++: 5× increase
- C++ to Perl: 1.3×
- Perl to Ruby: 3×
- Ruby to Python (-S): 1.6x
- Python -S to regular Python: 5×
- Python to Java: 1×-2×, depending on version/runtime
- branch percentage (per total instructions) is quite consistent across all of the programs
Overall, you get roughly three orders of magnitude slower startup between a plain C program using dietlibc and Python. And all, to do basically nothing.
On the other hand, I learned some interesting things while doing it, so it wasn’t quite for nothing ☺.